
Fuel and travel costs are pushing prices up again
Thursday 5 November 2026
Inflation has risen to 3.1%, meaning everyday spending is getting more expensive just as household budgets are already under pressure.
Collated published data from different sources for use in charts, tools, research and other applications.
Useful economic data is often scattered across files and sources, with different formats and definitions.
This API is a first step towards making selected datasets easier to find, understand and use consistently. It also provides the data behind Equinomics tools and visualisations.
Coverage is currently limited, and datasets, response formats and endpoints may change as development continues. We do not recommend that you rely on this data, or it's accuracy, for your projects or work at this point in time.
We offer interactive documentation to explore the endpoints and try requests. The OpenAPI specification is also available for development tools.
This proof-of-concept prototype demonstrates a limited set endpoints using real economic data from the ONS and WID (sources given along with each series).
The prototype is limited to these initial datasets. We'll expand coverage and documentation as the project develops.
Each link opens the data as JSON.
UK public spending across broad areas such as health, education and defence, covering financial years 2003/04 to 2025/26.
A more detailed breakdown of UK public spending within those broad areas, covering financial years 2021/22 to 2025/26.
How do median house prices compare with median annual earnings in England and Wales?
How have UK output per worker and inflation-adjusted total pay changed since 2000?
What share of UK income before tax goes to different population groups?
What share of UK wealth, after subtracting debts, is held by different population groups?
How has typical gross weekly pay for full-time employees changed, with figures for men, women and all employees?
Median gross weekly pay for full-time employees multiplied by 52 to estimate a yearly equivalent. These are not measured median annual earnings.
List UK parliamentary constituencies, their names, codes and nations.
Explore Burnley's available measures, breakdowns and comparisons, with sources and reporting periods.
ONS: https://www.ons.gov.uk/peoplepopulationandcommunity/housing/datasets
Keep in the loop
Highlights from about the UK economy, the UK government and the UK public sector.
Thursday 5 November 2026
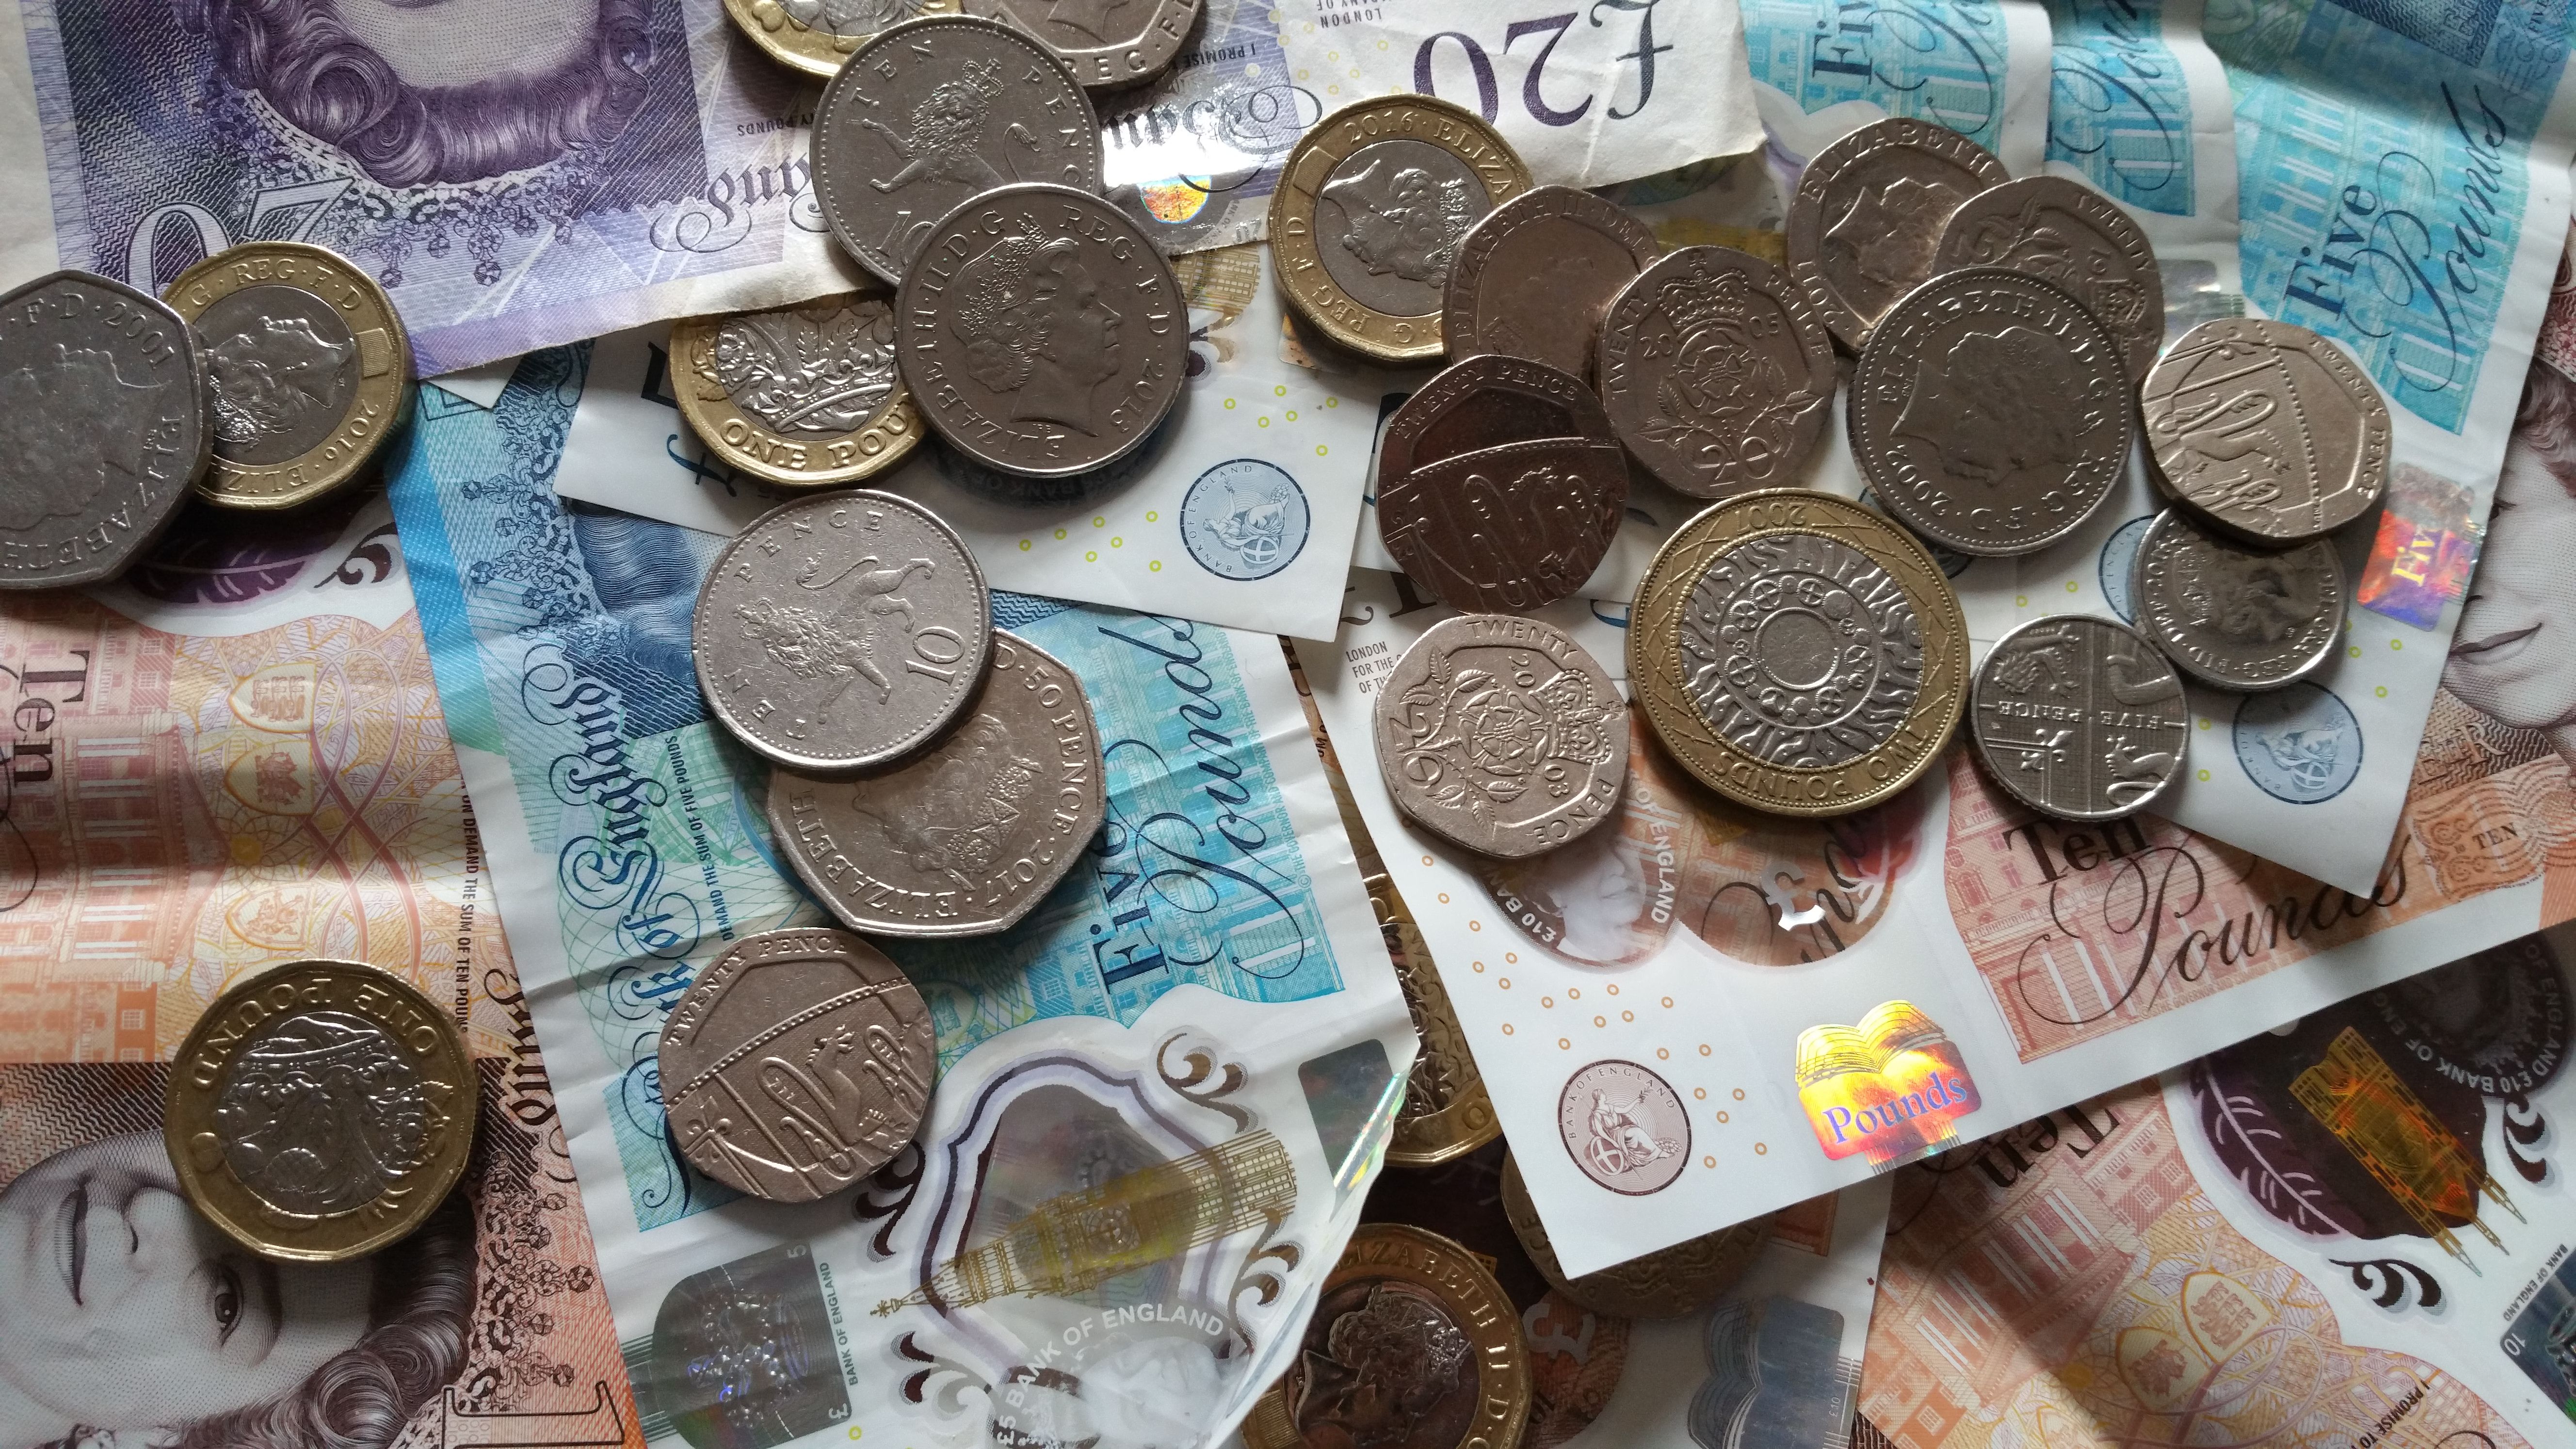
Inflation has risen to 3.1%, meaning everyday spending is getting more expensive just as household budgets are already under pressure.
Wednesday 4 November 2026
Interest rates are staying at 3.75%, so households with mortgages and other borrowing may have to wait longer for costs to come down.

Wednesday 4 November 2026
A higher energy price cap means many households will be paying more to heat and power their homes during the colder months.
Guides and insights
Clear, accessible analysis of the economic issues shaping everyday life

Living standards
Comparing the cost of everyday life across generations, from bread and beer to buying a home.

Food & prices
How farming, energy, transport and supermarket competition shape the price on the shelf.

Prices & inflation
What slower price rises mean for wages, purchasing power and economic recovery.

Shared prosperity
Beyond GDP: how we could measure economic success through security, opportunity and living standards.
We're looking to work with individuals and organisations who can contribute funding, expertise, data, technology, or strategic connections to help build better economic tools and research.