1. 1945–1949

    Rebuilding a sense of security

    The war is over, but shortages and damaged homes remain. Britain begins rebuilding around a new ambition: steadier employment, better housing and support when illness or hardship strikes.
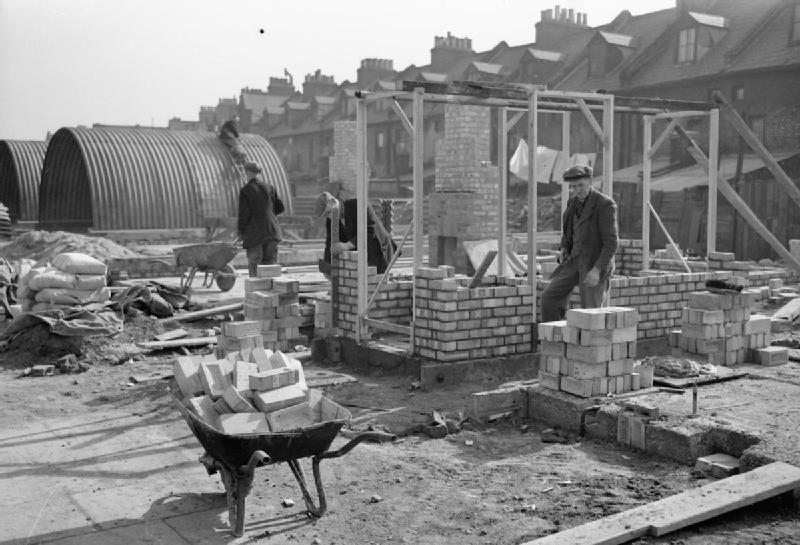
    Post-war housing and reconstruction
    • Work and pay

      Rebuilding working life

      The Distribution of Industry Act of 1945 supports new factories in areas affected by unemployment. The aim is to avoid returning to the joblessness of the interwar years. For households in those communities, rebuilding means the prospect of a regular wage closer to home. [1]

    • Homes and security

      A decent home is the priority

      The New Towns Act of 1946 makes planned new communities part of the response to housing shortages. For households in overcrowded or damaged accommodation, security begins with somewhere suitable to live, rather than a property investment. [2]

    • Everyday life and public services

      Illness becomes a shared responsibility

      The NHS opens in 1948, bringing services together with care initially free of charge. For families, this changes the relationship between illness and money: access to treatment is no longer supposed to depend on the ability to pay. [3]

    What did it mean for everyday life?

    The foundations of security are changing, even before daily life becomes comfortable. A job, a decent home and access to healthcare are becoming connected parts of the promise of recovery.

    1948 · The NHS opens

    Healthcare becomes a central part of the new settlement, shifting an important financial risk away from individual households. [3]

    Explore the evidence for this decade
    5 July 1948The National Health Service Act comes into effect in England and Wales; Scotland and Northern Ireland have separate legislation. This is an institutional milestone, not a measure of household living standards. [3]

    The post-war years were still years of scarcity. New institutions did not immediately remove poor housing, unequal opportunities or shortages.

    Sources for this chapter
    1. UK Parliament — Programming redevelopment after World War II
    2. UK Parliament — New towns
    3. UK Parliament — The National Health Service Act
  2. 1950–1959

    A wage begins to buy more

    As the economy grows, many households gain more room in their budgets. The post-war promise starts to become visible in better homes and greater choice, although opportunities remain unequal.

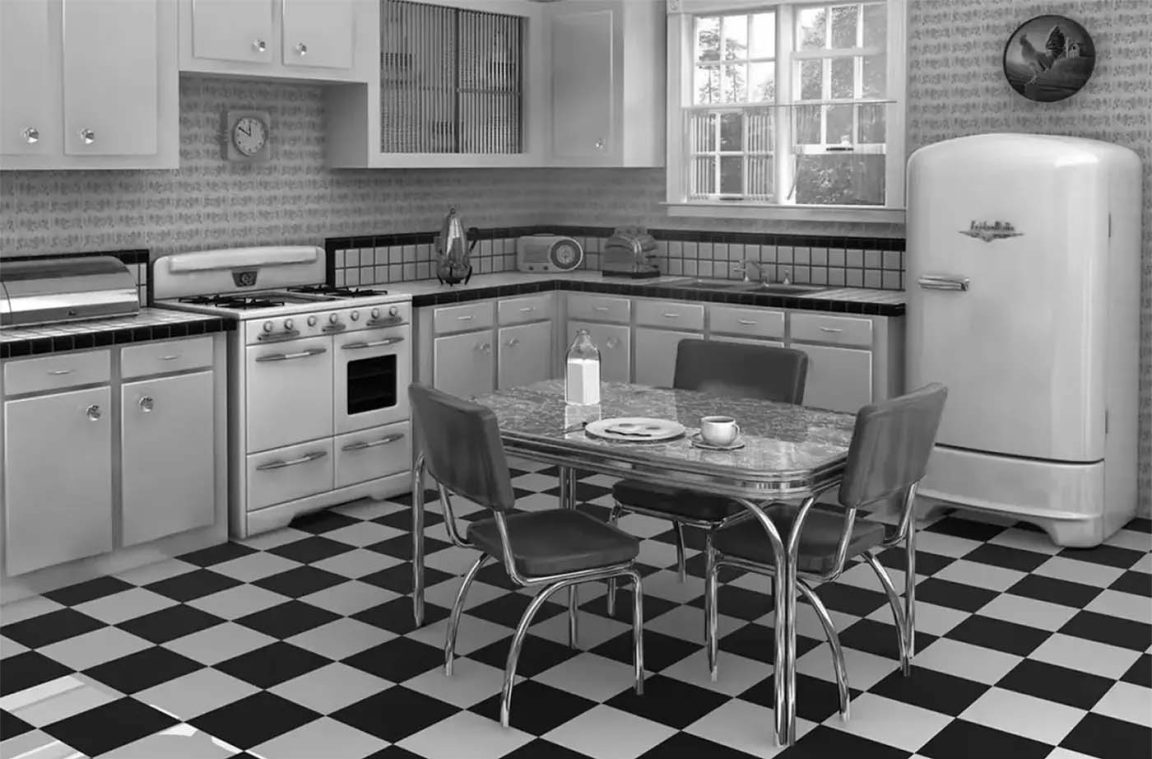
    1950s kitchen
    • Work and pay

      Steadier work, improving incomes

      Low unemployment and rising incomes in real terms give many workers greater confidence about the next pay packet. For a household, that can mean being able to plan a purchase or save, rather than constantly dealing with shortages. [1] [2]

    • Homes and security

      Building for everyday comfort

      New-town development continues through the decade. The housing story is about relieving overcrowding and creating new communities as well as ownership: the practical gains can be more space and a home better suited to family life. [3]

    • Everyday life and public services

      More choice at the kitchen table

      The final food rationing ends in July 1954. Shopping is less governed by ration books, and rising living standards expand household choices. That does not mean everyone can afford everything, but money increasingly determines what is available to a family. [4] [1]

    What did it mean for everyday life?

    For many families, security starts to include a little more choice and comfort. But the gains are uneven: women face restrictive expectations, and migrants can encounter discrimination when looking for work or somewhere to live.

    1950s · The people helping rebuild Britain

    Commonwealth migrants fill important jobs, yet some face barriers in employment and housing. The same growing economy can offer opportunity to one person and exclusion to another. [5]

    Explore the evidence for this decade
    July 1954 · Food rationing endsA turning point in everyday consumption. Rationing ending describes access and choice, not the disappearance of poverty. [4]

    Low unemployment is not the same as equal access to good jobs. Historical unemployment measures also differ from those used today.

    Sources for this chapter

    1. House of Lords Library — The UK economy in the 1950s
    2. House of Commons Library — Full employment
    3. UK Parliament — New towns
    4. The National Archives — Life in 1950s Britain
    5. The National Archives — Commonwealth migration since 1945
  3. 1960–1969

    Expectations rise, access differs

    The expectation of a better life takes hold, but a job and a home do not offer the same possibilities to everyone. Britain is becoming more prosperous while still carrying deep differences in opportunity.

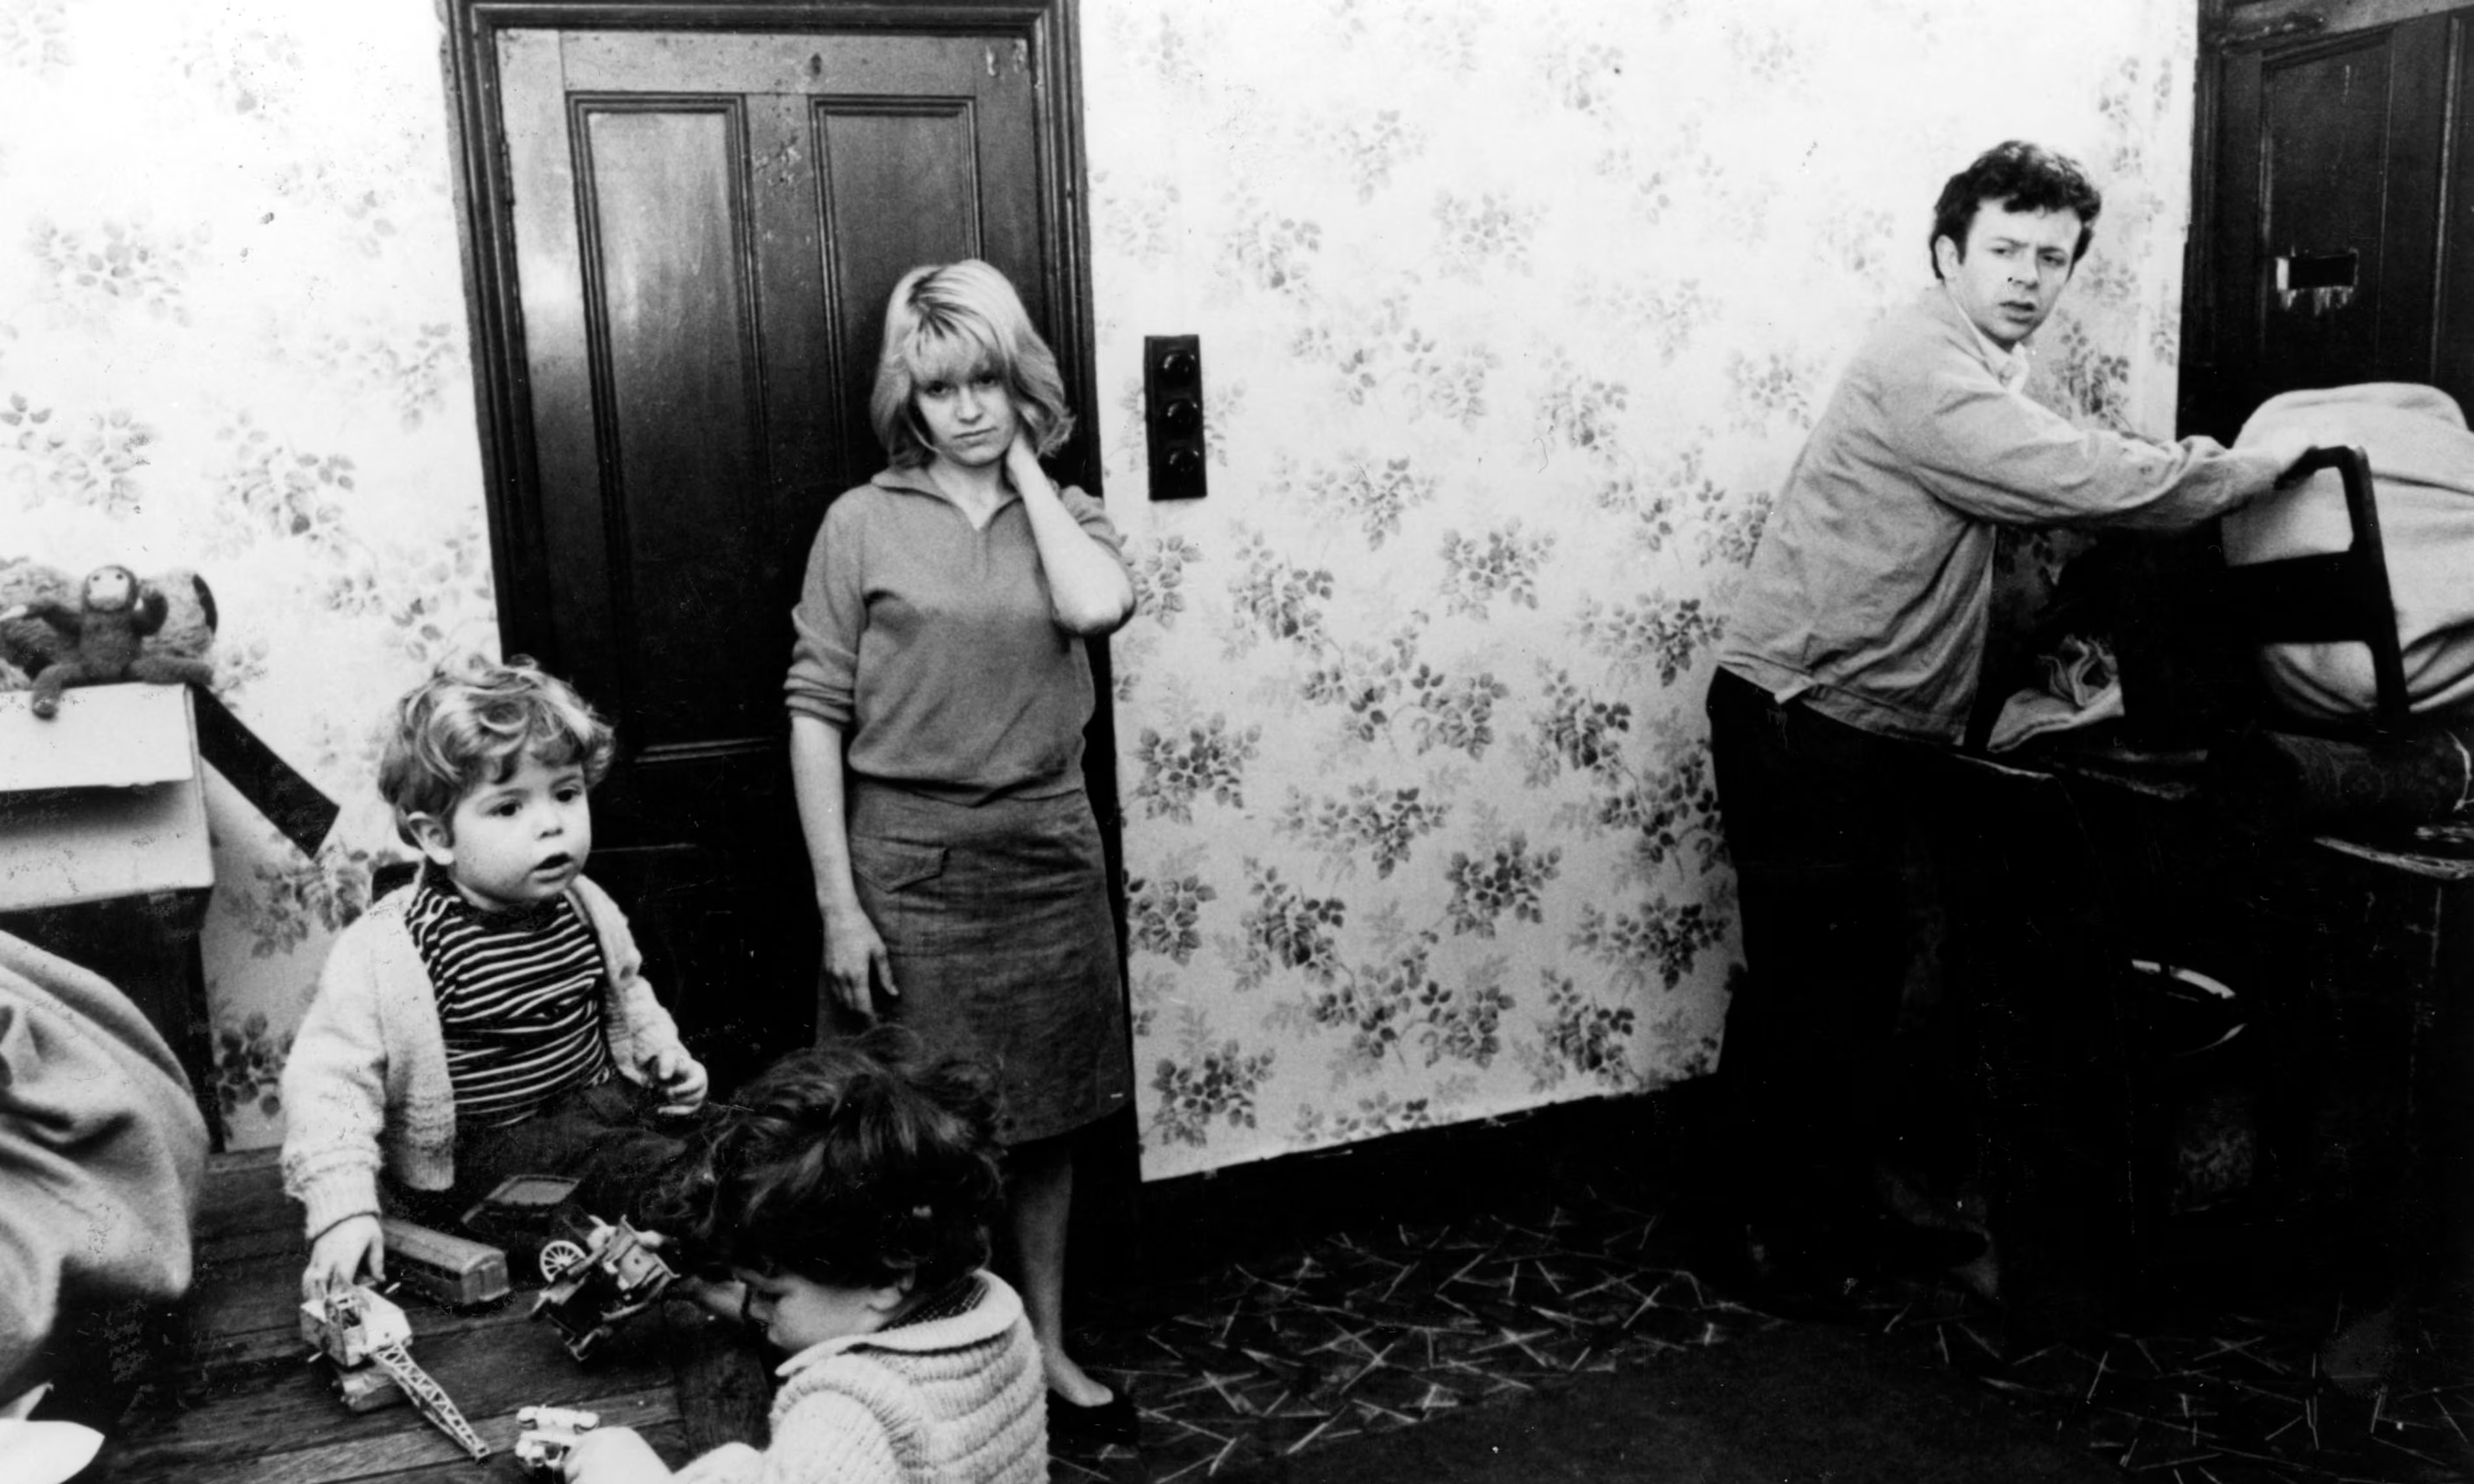
    Inside a 1960s home
    • Work and pay

      Working life is changing

      Unemployment remains low for much of the decade, while women’s participation in paid work grows. More people can earn an income of their own, though national improvement does not mean equal pay, equal treatment or identical prospects. [1] [2]

    • Homes and security

      Renting is still ordinary

      In 1961, only 42% of households in England and Wales own their home. Renting is the majority experience. Some homes still lack an inside toilet or fixed bath: having secure shelter and basic amenities remains a central part of progress. [3]

    • Everyday life and public services

      Comfort is about the basics, too

      The 1961 Census asks about sinks, hot water and cooking facilities. Those questions are a reminder that living standards are about time and effort as well as money: washing, bathing and running a household can demand very different work. [3]

    What did it mean for everyday life?

    The prospect of improvement is real, but the starting point matters. Household amenities, a fair chance at work and access to housing shape how much of Britain’s growing prosperity a person can actually experience.

    1968 · Discrimination in work and housing

    The Race Relations Act extends legal protection into employment and housing. This connects economic opportunity to rights: being able to afford a home or qualify for a job is not enough if discrimination blocks access. [4]

    Explore the evidence for this decade
    42% · Home-owning households in 1961England and Wales, from the ONS historical census comparison. This is a household tenure share; it does not show how affordable a mortgage was for a particular buyer. [3]

    This housing figure covers England and Wales, not the whole UK. Renting in this period should not be assumed to have the same costs, protections or tenure mix as renting today.

    Sources for this chapter

    1. House of Commons Library — Full employment
    2. ONS — Long-term trends in UK employment, 1861–2018
    3. ONS — Census unearthed: 50 years of change from 1961
    4. UK Parliament — Race Relations Act 1968
  4. 1970–1979

    The pay packet struggles to keep up

    The confidence of the earlier decades meets inflation and economic disruption. The question increasingly becomes whether a pay rise will cover the next increase in food, fuel or housing costs.

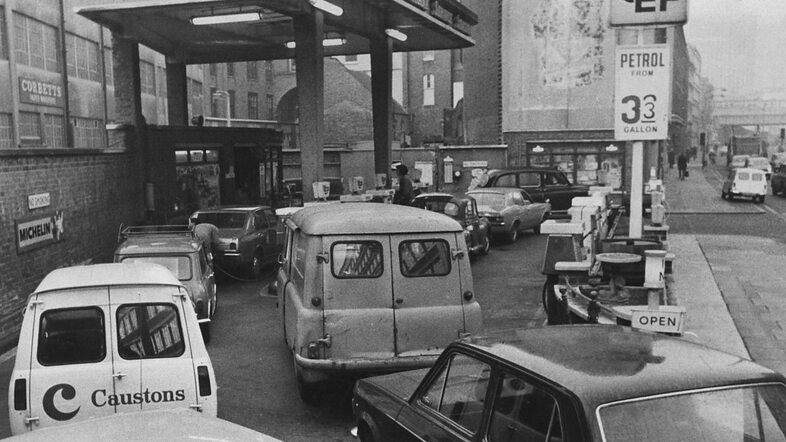
    1970s oil crisis
    • Work and pay

      A bigger wage may buy less

      High inflation makes wage bargaining central to working life. What matters to a household is whether real wages rise. The Equal Pay Act, passed in 1970 and effective in 1975, also changes women’s legal rights at work. [1] [2]

    • Homes and security

      Housing is not a simple bargain

      House prices rise sharply early in the decade, before the economic downturn slows that growth. A price alone cannot tell us what buying feels like: earnings, borrowing costs and the risk of losing work matter too. [3]

    • Everyday life and public services

      Energy shocks reach the home

      The oil crises of 1973 and 1979 add pressure to prices. In 1974, electricity restrictions during the three-day working week also disrupt production. Energy becomes something households and employers must worry about together. [1] [3]

    What did it mean for everyday life?

    Security becomes harder to judge from the number on a payslip. More money coming in may simply cover higher bills without improving purchasing power, while disrupted work makes it harder to plan. At the same time, new employment rights offer important progress.

    1974 · The three-day working week

    Restrictions on commercial electricity use show how an energy shortage can reach beyond the fuel bill into working hours and production. This was not a permanent three-day entitlement for every worker. [3]

    Explore the evidence for this decade
    1973 and 1979 · Oil shocksMajor turning points in the decade’s inflation story. Inflation measures differ, so a historical RPI figure should not be treated as directly interchangeable with modern CPI. [1]

    Inflation was not caused by one factor alone, and wage outcomes varied. The household effect described here is an explanation of purchasing power, not a claim that every worker became poorer.

    Sources for this chapter

    1. House of Lords Library — The UK economy in the 1970s
    2. House of Lords Library — Moving towards equal pay
    3. ONS — GDP and events in history
  5. 1980–1989

    Security takes different paths

    Britain’s economy changes direction. New opportunities and routes into ownership sit alongside industrial decline, unemployment and a widening gap between household incomes.

    Margaret Thatcher in the 1980s
    • Work and pay

      The local employer may disappear

      Manufacturing employment declines as the economy shifts towards services. For people in affected industrial communities, changing jobs can mean more than finding a new employer: it can change where work is available and which skills are valued. [1]

    • Homes and security

      Ownership opens for some tenants

      Right to Buy begins in England in 1980, allowing eligible council tenants to buy at a discount. It offers a route into ownership for buyers, while sales without sufficient replacement reduce the homes available for future social tenants. [2]

    • Everyday life and public services

      Household incomes pull apart

      Income inequality rises sharply across the 1980s. Prosperity is becoming less evenly shared: the same national economy can bring improving financial room to one household while another faces unemployment or struggles to maintain its living standard. [3]

    What did it mean for everyday life?

    A family buying its council home and a family losing an industrial wage can experience the decade very differently. Ownership, occupation and location increasingly shape the security that economic change brings.

    1984–1985 · The miners’ strike

    The dispute over pit closures brings the future of work into sharp focus for mining communities. It belongs in this story because an industry can anchor household incomes and the life of a place. [4]

    Explore the evidence for this decade
    1980 · Right to Buy introduced in EnglandThe policy’s immediate opportunity for eligible buyers and its longer-term effect on available social housing are distinct questions. The source here covers England. [2]

    Industrial employment had been changing before the 1980s; it did not begin declining with one government or one strike. Household income inequality is also different from inequality in accumulated wealth.

    Sources for this chapter

    1. ONS — Long-term trends in UK employment, 1861–2018
    2. House of Commons Library — Right to Buy in England
    3. IFS — Income and wealth inequality explained in five charts
    4. House of Commons Library — Miners and mining communities
  6. 1990–1999

    Recovery brings new possibilities

    The decade starts with recession and pressure on household finances. As recovery develops, employment improves and a national wage floor is introduced, but owning a home has also revealed its risks.

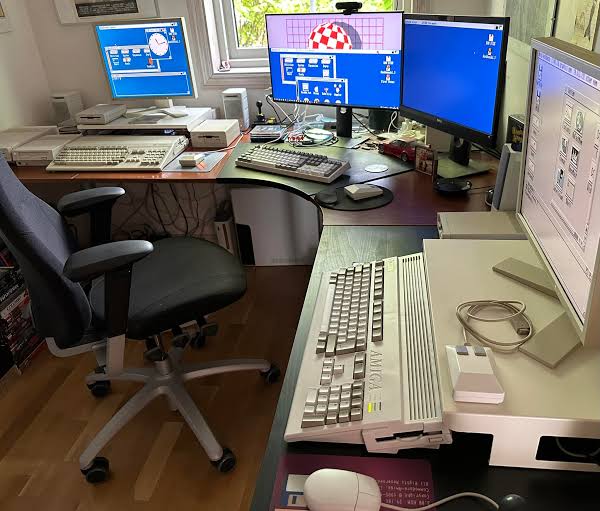
    1990s home office
    • Work and pay

      From job losses to a wage floor

      Employment expands from the mid-1990s. In April 1999, the National Minimum Wage introduces a national legal floor for eligible workers’ hourly pay. Recovery and new protections offer different routes towards more dependable household income. [1] [2]

    • Homes and security

      A home can become a financial trap

      During the early-1990s recession, falling house prices and stretched finances contribute to mortgage defaults. Negative equity means owing more than a home is worth: a household may find it harder to sell and move even when circumstances change. [3]

    • Everyday life and public services

      A new connection begins

      The internet begins entering homes; ONS starts collecting household-access statistics in 1998. It introduces new ways to find information and communicate, though access is uneven and it is still early in the shift towards online everyday life. [4]

    What did it mean for everyday life?

    Recovery can restore confidence about work and pay. But the housing downturn is a reminder that ownership does not guarantee security: a mortgage remains a commitment when income or the property’s value changes.

    1 April 1999 · The National Minimum Wage

    An important change for low-paid workers: hourly pay gains a national legal floor, although entitlement and rates vary by age and other conditions. [2]

    Explore the evidence for this decade
    1999 · A national wage floor beginsThis milestone establishes a pay protection, not a guarantee that earnings cover household costs. Hours worked, housing and family circumstances still matter. [2]

    Internet-access survey coverage and methods changed between 1998 and 2005. Early percentages should not be spliced into later figures as a perfectly comparable series.

    Sources for this chapter

    1. IFS — Inequality in the UK, 1968–2021
    2. Low Pay Commission — 20 years of the National Minimum Wage
    3. Bank of England — Household resilience and the early-1990s recession
    4. ONS — Internet access: households and individuals, 2013
  7. 2000–2009

    More possibilities, a higher housing hurdle

    Before the financial crisis, household incomes grow and public services receive more investment. But housing moves further out of reach relative to pay, creating different experiences for people who already own and those trying to buy.

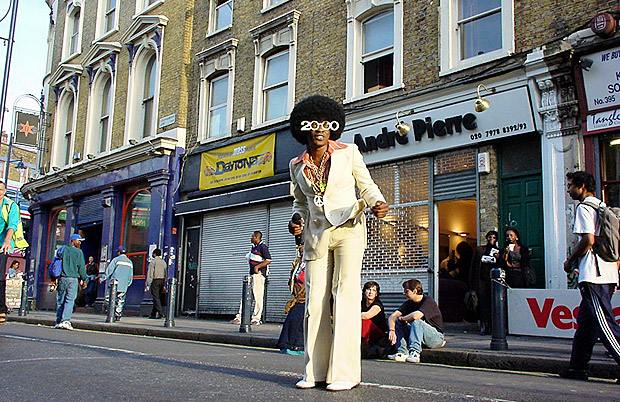
    Brixton high street in the 2000s
    • Work and pay

      Improvement, then a sudden interruption

      Household incomes rise in the years before the crisis, helped by employment and the tax-and-benefit system. The financial crisis and recession then interrupt that progress, showing how instability in banking can reach the jobs and incomes of ordinary households. [1] [2]

    • Homes and security

      The first home moves further away

      In England, the median house price to earnings ratio doubles between 1997 and 2007. Existing owners may see their assets rise in value; prospective buyers face a larger hurdle. That gain for an owner is not the same as extra cash to spend. [3]

    • Everyday life and public services

      Services receive more investment

      UK public health spending grows rapidly through the period ending in 2009–10. Alongside rising household incomes before the crisis, this shows another route through which prosperity can matter: the services people can rely on, as well as their private spending. [4] [1]

    What did it mean for everyday life?

    The route to a comfortable life is changing. Improvements in income and services can coexist with a home becoming harder to buy. Then the financial crisis unsettles plans that had seemed dependable.

    2008–2009 · The financial crisis and recession

    A crisis in the financial system becomes an everyday economic shock. Jobs, household spending and confidence are affected beyond the banks themselves. [2]

    Explore the evidence for this decade
    1997–2007 · England’s affordability ratio doublesONS compares median house sale prices with median gross annual earnings of full-time employees. This is a cross-decade change and a single-worker earnings measure, not household income or the number of years needed to repay a mortgage. [3]

    This ratio does not include deposit requirements, interest rates or a buyer’s circumstances. Greater health funding is an input into services, not proof that all patients’ experiences improved.

    Sources for this chapter

    1. IFS — Inequality in the UK, 1968–2021
    2. ONS — GDP and events in history
    3. ONS — Housing affordability in England and Wales, 2024
    4. IFS — UK health spending, 2019
  8. 2010–2019

    Working harder to make progress

    The aftermath of the crisis changes the pace of improvement. Employment recovers, but weak growth in pay and living standards makes moving towards a home, savings or greater security harder for many households.

    Household budgets in 2010s
    • Work and pay

      More employment, slower progress

      Employment rises, but the economy’s weak growth in labour productivity holds back the growth that can support better wages. For a household, having work and feeling better off are different things: progress depends on what remains after essential costs. [1] [2]

    • Homes and security

      Ownership divides generations

      By 2011, home ownership in England and Wales has fallen from its 2001 share. Research also finds younger generations less likely to own at the same age as earlier cohorts. A deposit can become a bigger obstacle to starting an independent household. [3] [4]

    • Everyday life and public services

      Support and services face restraint

      Austerity brings cuts to many public-service budgets and to the generosity of working-age benefits. Health is relatively protected, so the picture differs across services. For households needing support, financial security depends on public provision as well as wages. [1]

    What did it mean for everyday life?

    A person can be employed yet struggle to build a financial cushion or buy a first home. This is not simply a story of every income gap widening: slow income growth and differences in asset ownership both matter.

    After 2008 · A different pace of improvement

    Weak growth persists well beyond the immediate recession. Following its effect through the decade helps explain why a recovery in employment does not necessarily restore earlier expectations about living standards. [1]

    Explore the evidence for this decade
    Income and wealth tell different storiesIFS finds that most measures of household income inequality are more stable after the 1980s surge. That does not mean opportunity is unchanged: slow income growth and the value of assets affect people’s ability to accumulate security. [4]

    Austerity did not mean every public budget fell. Income comparisons must state whether they account for household size, taxes, benefits and housing costs.

    Sources for this chapter

    1. IFS — The Conservatives and the Economy, 2010–2024
    2. IFS — Inequality in the UK, 1968–2021
    3. ONS — Home ownership and renting, 2001–2011
    4. IFS — Income and wealth inequality explained in five charts
  9. 2020s · so far

    A test of the household safety net

    The pandemic disrupts work and daily life, followed by sharp pressure on food and energy costs. These shocks test the same foundations of security traced through the timeline: income, housing and support when circumstances change.

    Food bank donations 2020s
    • Work and pay

      Keeping an income when work stops

      The furlough scheme supports jobs during the pandemic. It shows how public support can cushion an interruption to work, while experiences differ between people able to work from home, those on furlough and those whose roles require them to be present. [1]

    • Homes and security

      The monthly payment matters, too

      The period after the pandemic combines difficult housing affordability with higher interest rates. Mortgage affordability depends on both the price of a home and the cost of borrowing. A mortgage holder coming off a fixed rate can also face higher monthly payments. [2] [3]

    • Everyday life and public services

      Food and energy squeeze the budget

      CPI inflation reaches 11.1% in October 2022, with energy and food important contributors. Essentials take priority, leaving less room for other spending when income does not keep pace. Later disinflation means slower price rises, not automatically cheaper shopping. [4]

    What did it mean for everyday life?

    The same shock can have very different consequences. Savings, a secure tenancy, manageable debt and access to support can provide a cushion; without them, a rise in essential bills can force difficult choices about other spending.

    2020–2021 · Furlough cushions the shock

    HMRC records 11.7 million unique jobs supported at some point during the scheme. That is a cumulative jobs figure, not 11.7 million people on furlough at once, and it does not prove every supported job would otherwise have been lost. [1]

    Explore the evidence for this decade
    11.1% · Annual CPI inflation, October 2022UK consumer prices compared with October 2021. This is a one-year change in the average basket, not the rise in every household’s bills or the cumulative rise across the decade. [4]

    This decade is still unfolding. The selected developments and numerical examples are dated historical observations, not a live snapshot of the latest figures. The effects on households are explanatory interpretations, not individual testimonies.

    Sources for this chapter

    1. HMRC — Coronavirus Job Retention Scheme statistics, December 2021
    2. ONS — Housing affordability in England and Wales, 2024
    3. IFS — The Conservatives and the Economy, 2010–2024
    4. ONS — Consumer price inflation, October 2022

About this timeline: a selective economic history, not an account of every household. Experiences differ by place, income, age, gender and ethnicity. Source geographies and observation dates are stated where relevant. The 2020s chapter is ongoing; figures are dated examples. Photographs remain placeholders.

Preview

Keep in the loop

News

Highlights from about the UK economy, the UK government and the UK public sector.

Shopper calculating the cost of groceries

Fuel and travel costs are pushing prices up again

Thursday 5 November 2026

Inflation has risen to 3.1%, meaning everyday spending is getting more expensive just as household budgets are already under pressure.

Shopper calculating the cost of groceries

Mortgage relief will have to wait a little longer

Wednesday 4 November 2026

Interest rates are staying at 3.75%, so households with mortgages and other borrowing may have to wait longer for costs to come down.

Shopper calculating the cost of groceries

Energy bills are going up as winter approaches

Wednesday 4 November 2026

A higher energy price cap means many households will be paying more to heat and power their homes during the colder months.

Preview
Let's work together

Get in touch

We're looking to work with individuals and organisations who can contribute funding, expertise, data, technology, or strategic connections to help build better economic tools and research.

General Enquiry